Table of Contents
show
GroupBy
- Pandas groupby is used for grouping the data according to the categories and apply a function to the categories
- Helps to aggregate data efficiently
- It is mostly used with aggregate functions (count, sum,min,max,mean) to get the statistics based on one or more column values
- Also called Split-Apply-Combine process
- The groupby() function splits the data based on some criteria
- The aggregate function is applied to each of the groups
- The groups are combines together to create the result DataFrame
import pandas as pd
data = {'item' :['tea','coffee','sugar','tea','coffee','sugar','tea','coffee','sugar','tea','sugar','tea'],
        'year':[2010,2010,2010,2011,2011,2011,2012,2012,2012,2011,2012,2011],
        'sales':[1200,1050,500,1500,1200,1000,1230,1300,1420,300,1420,300]}
df = pd.DataFrame(data,columns=['item','year','sales'])
print("Data:\n",df)
print(type(df))
Why groupby() function
- To select the data based on groups and understand aggregated data on a group level.
- Though pandas allows us to iterate over every row in a dataframe, it is generally very slow to do so.
- Fortunately Pandas has a groupby() function to speed up such task.
- The idea behind the groupby() function is that it takes some dataframe, splits it into chunks based on some key values, applies computation on those chunks, then combines the results back together into another dataframe.
- In Pandas, this is referred as split-apply-combine pattern
groupby()
- Split data into groups based on one column
- Pandas object can be split into a group in many ways.
Syntax:
Dataframeobject.groupby(‘colname’);- groupby() actually returns a tuple; where the first value is the value of the key we are trying to group by ; and second one is projected dataframe
- Split data into groups based on one column
Dataframeobject.groupby(‘colname’,’colname1’);#number of instances in dataframe
print("Length of dataframe:",len(df))
print("Length of groups:",len(group1))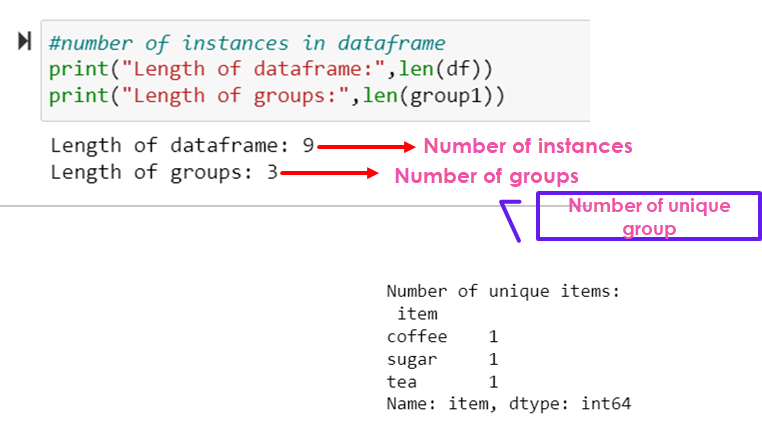
#to print number of unique groups
print("Number of unique items:\n",group1['item'].nunique())
#group by single column
group1=df.groupby(['item'])
group1
print(group1.size())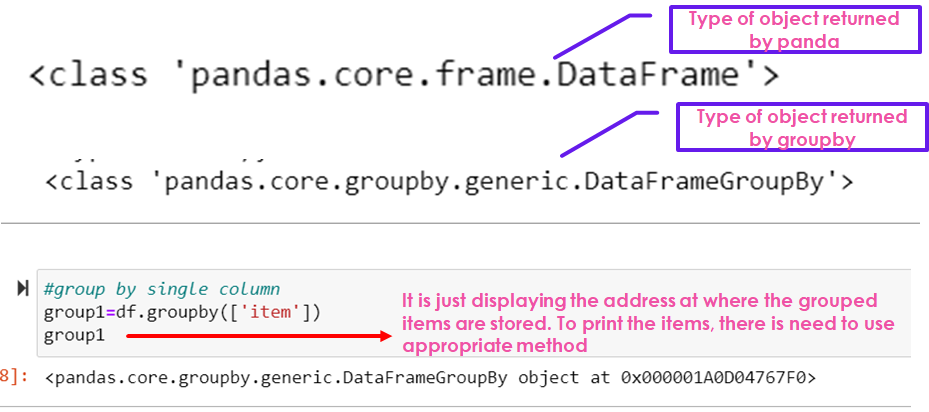
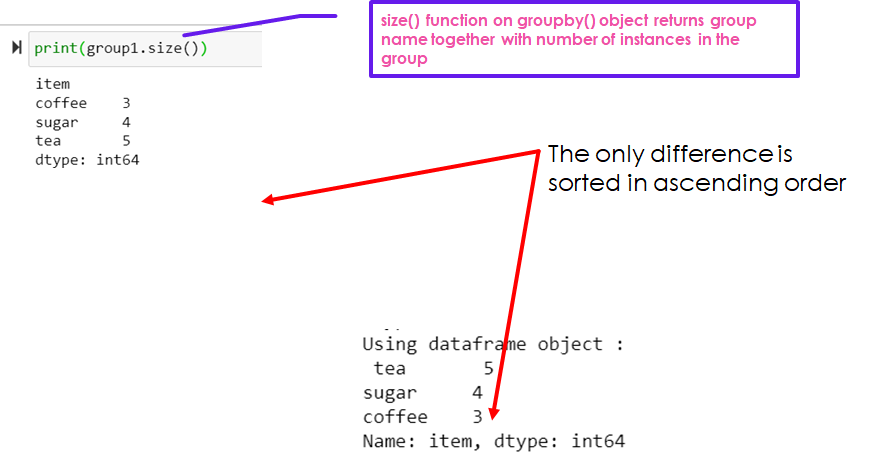
print("Using dataframe object :\n",df["item"].value_counts())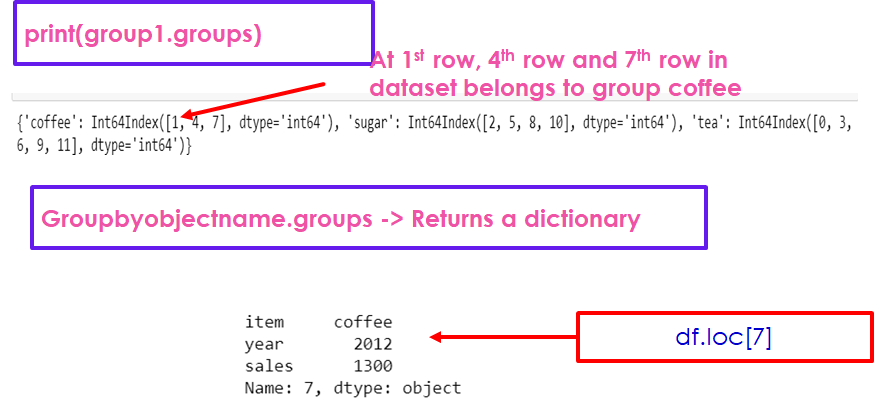
# to get first row in each group
print(group1.first())
# to get last row in each group
print(group1.last())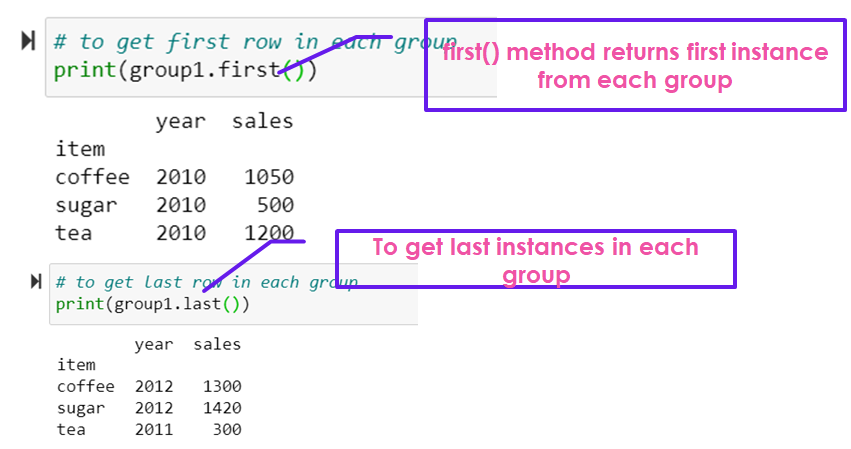
To get the dataframe of a particular group
#using get_group to select particular group
group1.get_group('sugar')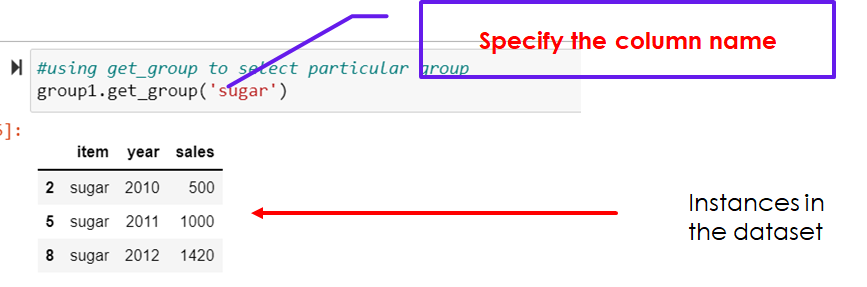
Methods on the groupby object and DataFrame Columns
# to print max
print("Maximum in each group:\n",group1.max())
# max() looks the nearest column of item based on which the group is created; here nearest column of item is
#year,so the maximum value from year is selected and displayed for each group
# max and min function can be applied over columns with string values
print("Minimum in each group:\n",group1.min())
#sum function can be applied over solumns with numerical values
print("Sum across each group:\n",group1.sum())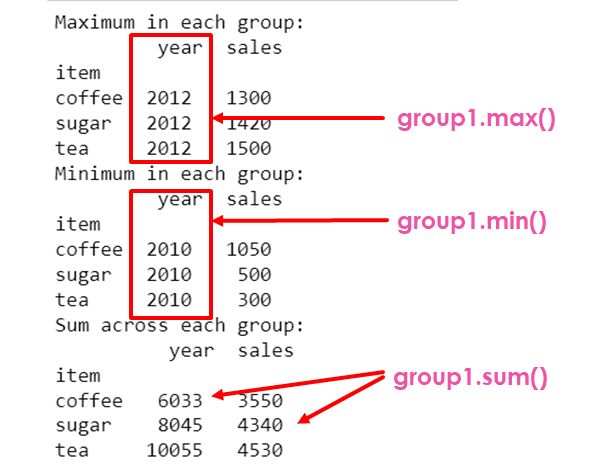
To compute the sum for a particular column using dataframe object and groupby object
Getting sum values for specific group
# using the groupby object
print(group1["year"].sum()) # possible to pass list of strings separated by commas
print("--------------------------")
# to get the total number of sales for each group
print(group1["sales"].sum())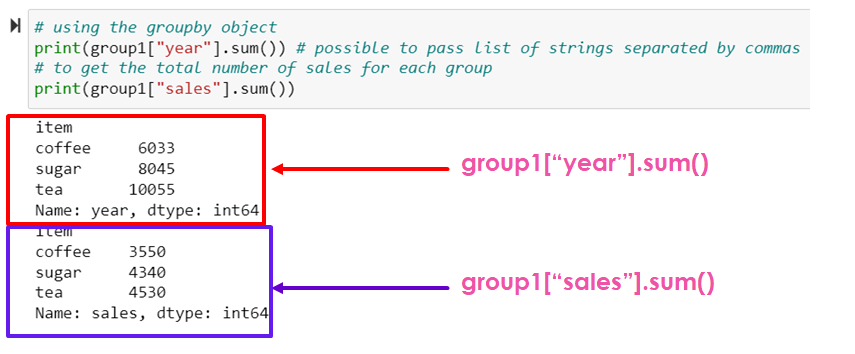
The return type of these methods are series
#find the max sales
print("Max sales:\n",group1["sales"].max())
print("--------------------------")
#find the min sales
print("Min sales: \n",group1["sales"].min())
print("--------------------------")
# find the average sales
print("Average sales:\n",group1["sales"].mean())
--------------------------
Max sales:
item
coffee 1300
sugar 1420
tea 1500
Name: sales, dtype: int64
--------------------------
Min sales:
item
coffee 1050
sugar 500
tea 300
Name: sales, dtype: int64
--------------------------
Average sales:
item
coffee 1183.333333
sugar 1085.000000
tea 906.000000
Name: sales, dtype: float64Methods on the groupby object and DataFrame Columns
#using multiple columns
print(group1[["year","sales"]].sum()) # returns a dataframe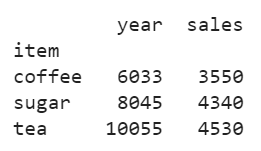
Grouping by Multiple Column
Index in the datframe
#group by multiple column
#create a dataframe
data2 = pd.DataFrame( {"Country": ['India','India','USA','USA','India'],
                      "Company":['TN','LA','TN','LA','TN'],
                      "Revenue":[4500,2500,6200,4200,8000],
                      "Profit":[6500,8500,2500,2000,2500]
                     })
group2 = data2.groupby(["Country","Company"])
group2.groups
{('India', 'LA'): Int64Index([1], dtype='int64'),
('India', 'TN'): Int64Index([0, 4], dtype='int64'),
('USA', 'LA'): Int64Index([3], dtype='int64'),
('USA', 'TN'): Int64Index([2], dtype='int64')}Number of instances
print(group2.size())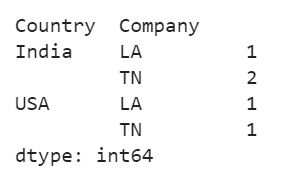
group2.sum() # for each numerical column sum is found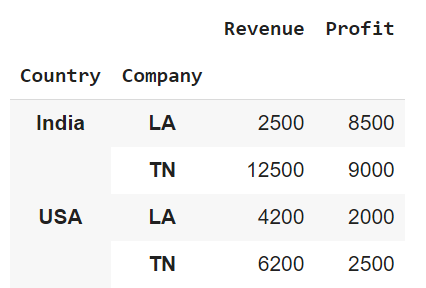
#calculating sum for particular column
print(group2['Revenue'].sum())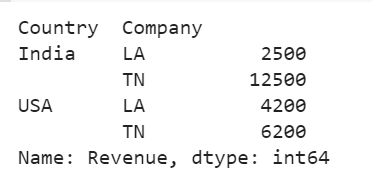
The .agg() Method
It is called on groupby object
Column name passed in a dictionary as a key with value as a operation
group3 = data2.groupby('Country')
#performing collection of operations on each column
#agg function returns a dataframe
df1 = group3.agg( { "Revenue":"sum",
                   "Profit":"sum"})
print(df1)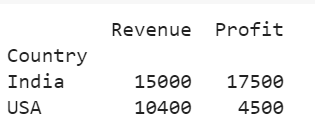
Passing list as a argument with the operations to be performed
#for each column find the size, sum and mean
df2 = group3.agg(['size','sum','mean'])
df2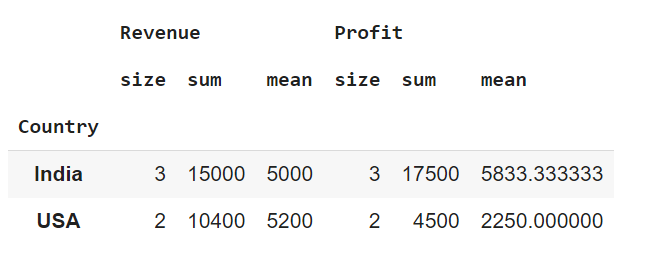
Passing list of operations as a value for the key, column Revenue
df3 = group3.agg( { "Revenue":["sum","mean"],
                   "Profit":"sum"})
print(df3)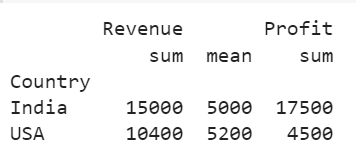
Specifying group1 variable within the subscript specifying column name
Lets to apply the aggregate function over the specified column
print("For slaes:\n",group1['sales'].agg(['count','min']))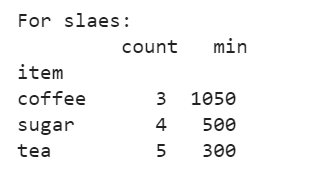
Iterating over the Groups
#print the group elements by iterating throgh
for itemname,groupname in group1:
    print('{}:'.format(itemname))
    print(groupname)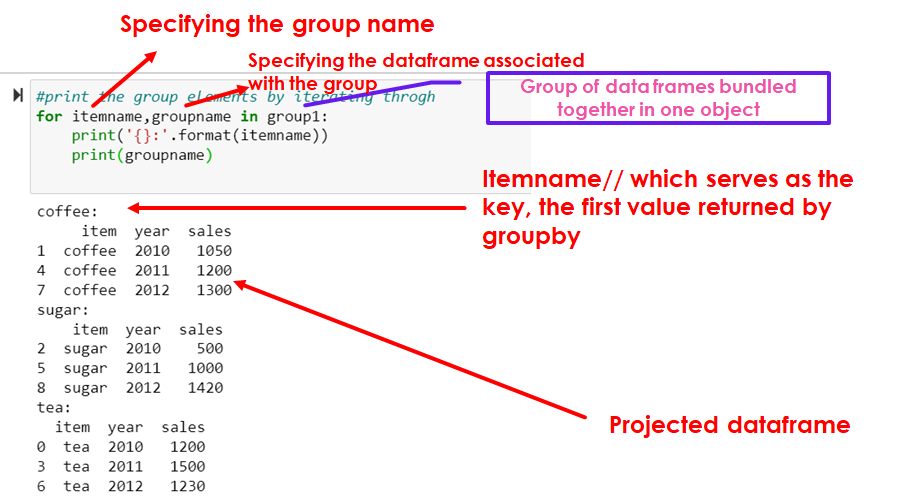
Display the highest revenue company in each country
#Extract the max profit of the company in each country
print(group3["Profit"].max())
# alternative way:
#Display the highest revenue company in each country and store it in dataframe
df_todisplay = pd.DataFrame(columns = data2.columns)
#df_todisplay
for gr,gr_df in group3:
    comp_high_revenue = gr_df.nlargest(1,"Revenue")
    df_todisplay = df_todisplay.append(comp_high_revenue)
df_todisplay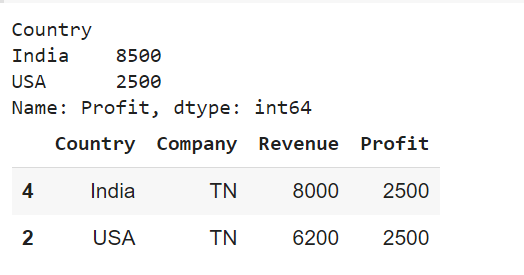
largest(attr1,attr2)- takes two arguments; the first argument represents the integer number which represents the number of largest elements
The second argument represents the column name on which to pick the largest value
#Display the highest revenue for each company
group4 = data2.groupby("Company")
df_high_revenue_country = pd.DataFrame(columns = data2.columns)
for gr,gr_df in group4:
    comp_high_revenue = gr_df.nlargest(1,"Revenue")
    df_high_revenue_country = df_high_revenue_country.append(comp_high_revenue)
df_high_revenue_country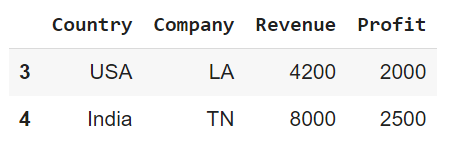
Specify the column name to get mean
# to compute mean for each group
for itemname,groupname in group1:
    print('{}:'.format(itemname))
    print("The item,", itemname,"has average sales of:", groupname['sales'].mean())
    print()
coffee:
The item, coffee has average sales of: 1183.3333333333333
sugar:
The item, sugar has average sales of: 1085.0
tea:
The item, tea has average sales of: 906.0Call the function max() to get max value in the couln specified
#to compute max sales for each item
for itemname,groupname in group1:
    print('{}:'.format(itemname))
    print("The item,", itemname,"has average sales of:", groupname['sales'].max())
    print()
coffee:
The item, coffee has average sales of: 1300
sugar:
The item, sugar has average sales of: 1420
tea:
The item, tea has average sales of: 1500
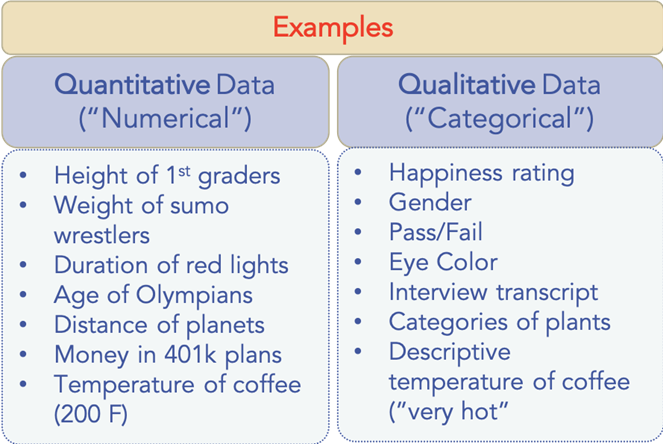
Qualitative and Quantitative Data Analysis
Quantitative vs. Qualitative
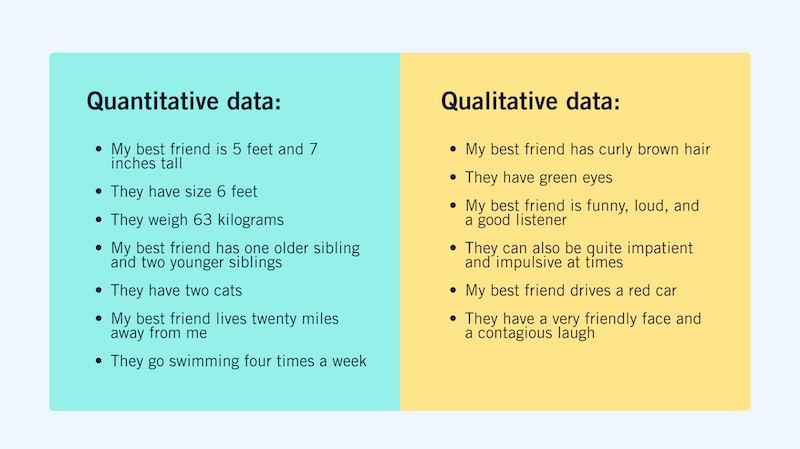
Examples
Views: 1