Pandas Data Structures
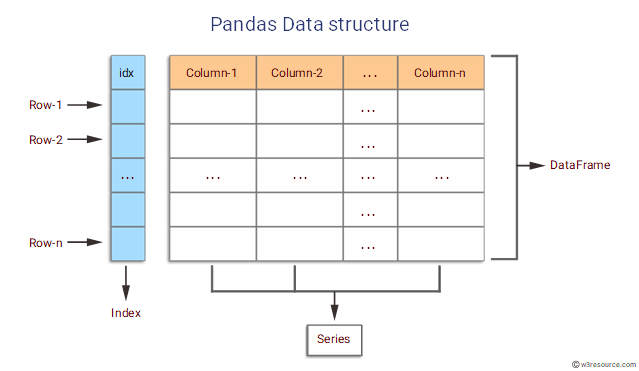
Series
A series is a one-dimensional array-like object containing an array of data (of any numpy data type) and an associated array of data labels called its index
The different ways to create a series:
- Create an Empty series in pandas
- Create a series from array without indexing
- Create a series from array with indexing
- Create a series from dictionary
- Create a series from scalar value
- Create a series from list in pandas Create Series from multi list
How to access the elements in Series?
- Accessing data from series with position:
- Accessing data from series with labels or index
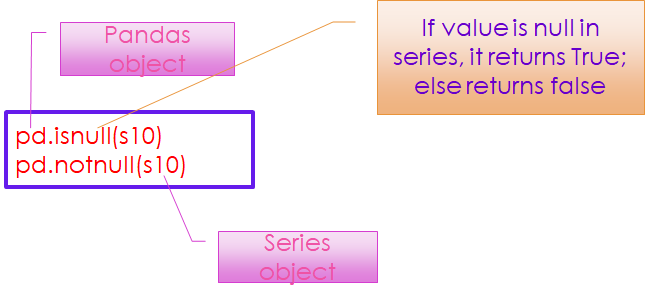
To detect missing data
- isnull()
- notnull()
Both the series object and its index have a name attribute, which integrates
s11.name = 'Marks' #Assigning column name for series
s11.index.name='student Names' #Assign name for index
s11.index = ['aaa','bbb','xxx','ccc'] #Assign values for index
Use of method between()
Syntax:
Series.between(left, right, inclusive=True)Parameters:
- left: A scalar value that defines the left boundary
- right: A scalar value that defines the right boundary
- inclusive: A Boolean value which is True by default. If False, it excludes the two passed arguments while checking.
Return Type:
A Boolean series which is True for every element that lies between the argument values.
- This method does not work for strings
- Only for 1D
Use of between() method
Find the employee whose salary is between 12000 to 2000 both inclusive
data_c = pd.read_csv("F:/Advanced Python/Module - 2/Dataset/Dataset6.csv")
data_c
#Find the employee whose salary is between 12,000 to 20,000 both inclusive
Emp = data_c['Salary'].between(12000, 20000, inclusive=True)
print(Emp) # Emp is a Series with boolean values
print(data_c[Emp])
# Equaivalent Statement of above: print(data_c[data_c['Salary'].between(12000,20000)])
0 False
1 True
2 False
3 True
4 True
5 True
Name: Salary, dtype: bool
Name Age Designation Salary
1 Rudra 23 Assistant 20000
3 Tony 24 Clerk 12000
4 John 23 Office Asst 13500
5 James 23 Steno 14000
Name Age Designation Salary
1 Rudra 23 Assistant 20000
3 Tony 24 Clerk 12000
4 John 23 Office Asst 13500
5 James 23 Steno 14000Data Frame
- A data frame represents a tabular, spreadsheet-like data structure containing an ordered collection of columns, each of which can be a different value type (numeric, string, Boolean)
- The dataframe has both a row and column index;
- It can be thought of as a dict of series (one for sharing the same index)
Create a data frame using dictionary
While converting dataframe to dictionary by default all the keys of the dict object becomes columns, and the range of numbers 0,1,2,…,n is assigned as row index
Create a data frame using from_dict()
Syntax
DataFrame.from_dict(data,orient=‘columns’,dtype=None,columns= None)data:
It takes dict, list, set,ndarray, Iterable or DataFrame as input
An empty dataframe will be created if it is not provided. The resultant column order follows the insertion order
Orient: (optional)
If the keys of the dict should be the rows of the DataFrame, then set orient –index, else set it to column (Default)
Dtype: (optional)
Data type to force on resulting DataFrame. Only a single data type is allowed. If not given, then it’s inferred from the Data
Columns: (Optional)
- Only be used in case of orient=“index” to specify column labels in the resulting DataFrame.
- Default column labels are range of integer i.e. 0,1,2,…,n
- If we use the columns parameter with orient = ‘columns’ then it throws ValueError
- Create data frame using read_excel: refer code
- Create dataframe using read_csv: refer code
Basic Functions in data frame
- info() method prints the information about the dataframe
- The information contains the number of columns, column labels, column data types, memory usage, range index, and the number of cells in each column (non-null values
- It does not return any values. Rather it prints the values
data_pt = pd.read_csv("F:/Advanced Python/Module - 2/Dataset/Dataset9.csv")
data_pt.info()
<class 'pandas.core.frame.DataFrame'>
RangeIndex: 5 entries, 0 to 4
Data columns (total 4 columns):
# Column Non-Null Count Dtype
--- ------ -------------- -----
0 Name 5 non-null object
1 Gender 5 non-null object
2 Salary 5 non-null int64
3 Age 5 non-null int64
dtypes: int64(2), object(2)
memory usage: 288.0+ bytes- describe() method returns description of the data in the Data Frame
- If the dataFrame contains numerical data, the description contains
- Count – the number of not-empty values
- Mean – average ( mean value
- Std – standard deviation
- Min – the minimum value
- 25% – the 25% percentile
- 50% – the 50% percentile
- 75% – the 75% percentile
- Max – the maximum value
data_pt.describe()
         Salary	          Age
count	5.000000	5.000000
mean	15400.000000	29.000000
std	12381.437719	7.582875
min	5000.000000	23.000000
25%	7000.000000	24.000000
50%	10000.000000	25.000000
75%	20000.000000	32.000000
max	35000.000000	41.000000
data = [[10, 20, 0], [10, 10, 10], [10, 20, 30]]
df = pd.DataFrame(data)
print(df.nunique()) # by default searches in the column and return the unique values0 1
1 2
2 3
dtype: int64print(df.nunique(axis="columns")) #searches in the row and return the unique values0 3
1 1
2 3
dtype: int64value_counts() is used to get a series containing counts of unique values
Syntax
Series.value_counts(self, normalize = False, sort = True, ascending = False, bins= None, dropna = True)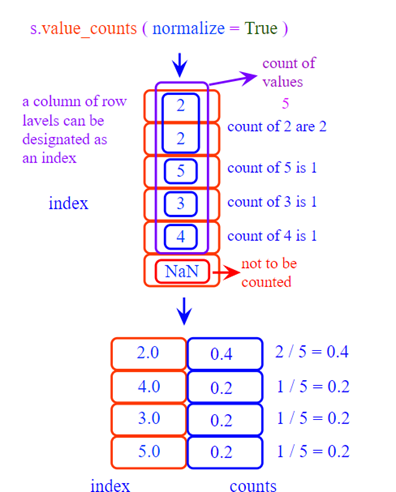
where()
Pandas where() method is used to check a dataframe for one or more condition and return the result accordingly.
By default, the rows not satisfying the condition are filled with NaN value
DataFrame.where(condition, other=nan, inplace=False, axis = None)- Cond: one or more condition to check data frame for
- Other: Replace rows which don’t satisfy the condition with user defined object. Default is NaN
- Inplace: Boolean value, Makes changes in data frame itself if True
- axis: axis to check (rows or columns)
data_f = pd.read_csv("F:/SRIHER/2021-2022/Quarter - 3/Advanced Python/Module - 2/Dataset/Dataset6.csv")
data_f
# create a filter
#using single condition: filter only the instances having the designation as Assistant
f1 = data_f['Designation']=='Assistant'
data_f1=data_f.where(f1,  inplace=False)# other can be given like this: other="-",
print(data_f1)
Name Age Designation Salary
0 NaN NaN NaN NaN
1 Rudra 23.0 Assistant 20000.0
2 Siva 21.0 Assistant 10000.0
3 NaN NaN NaN NaN
4 NaN NaN NaN NaN
5 NaN NaN NaN NaNsort_values()
Pandas sort_values() function sorts a data frame in Ascending or Descending order of passed Column
DataFrame.sort_values(by,axis=0, ascending = True, inplace=False, kind=‘quicksort’, na_position=‘last)Parameters
- by: single / list of column names to sort Data Frame by
- axis: 0 or “index” for rows and 1 or “ columns” for columns
- Ascending: Boolean value which sorts Data frame in ascending order if True
- Inplace: Boolean value. Makes the changes in passed data frame itself if True
- kind: String which can have three inputs (‘quicksort’, ‘mergesort’ or ‘heapsort’) of algorithm used to sort data frame
- na_position: Takes two string input ‘last’ or ‘first’ to set postion of Numm values. Default is last
data_f2 = data_f.sort_values('Name')
print(data_f2)
Name Age Designation Salary
0 Abhinesh 31 Tech Leader 40000
5 James 23 Steno 14000
4 John 23 Office Asst 13500
1 Rudra 23 Assistant 20000
2 Siva 21 Assistant 10000
3 Tony 24 Clerk 12000corr()
- DataFrame.corr() method is used to find the pairwise correlation of all columns in dataframe
- Any na values are automatically exclude
- For any non numeric data type columns in the data frame it is ignored
DataFrame.corr(self,method = ‘pearson’)Parameters:
- Method:
- pearson: standard correlation coefficient
- Kendall: Kendall Tau correlation coefficient
- Spearman: Spearman rank correlation
Returns:
- count: y: DataFrame
Pearson coefficient
data_co= pd.read_csv("F:/Advanced Python/Module - 2/Dataset/Dataset7.csv")
data_co
data_co.corr()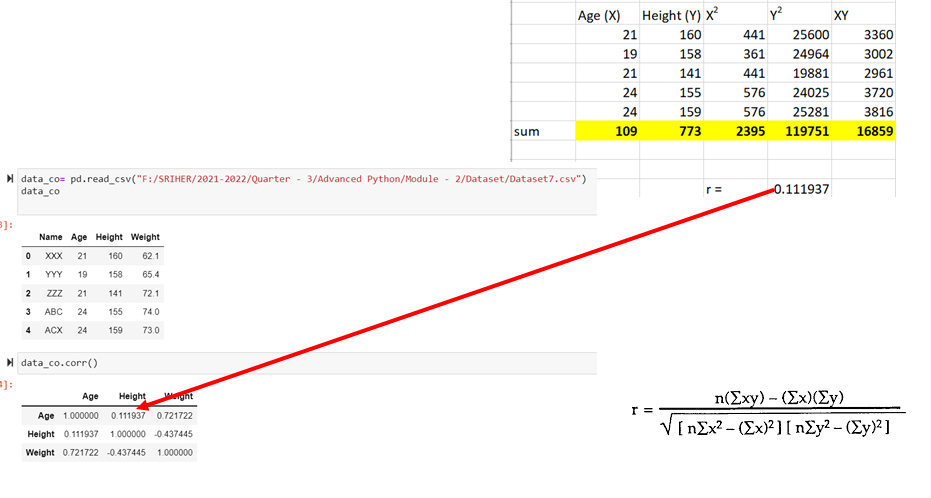
get_dummies()
The datasets often include categorical variables
data_co1= pd.read_csv("F:/Advanced Python/Module - 2/Dataset/Dataset8.csv")
data_co1
Name Age Height Weight Gender Studying
0 XXX 21 160 62.1 M Y
1 YYY 19 158 65.4 F N
2 ZZZ 21 141 72.1 M Y
3 ABC 24 155 74.0 F N
4 ACX 24 159 73.0 F YExamples:
- Marital status (“married,”single”, “divorced”)
- Smoking status (“smoker”, “non-smoker”)
- Eye color (“blue”, “green”, “hazel”)
- Level of education (“high school”, “Bachelor’s degree”, “Master’s degree”)
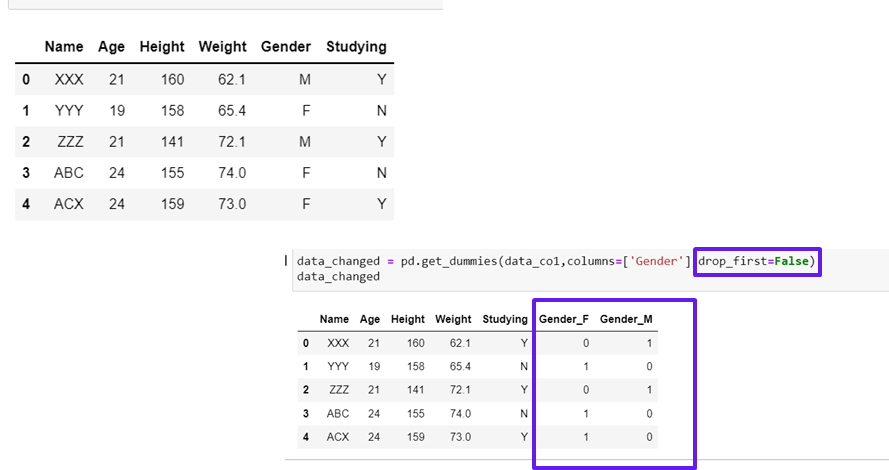
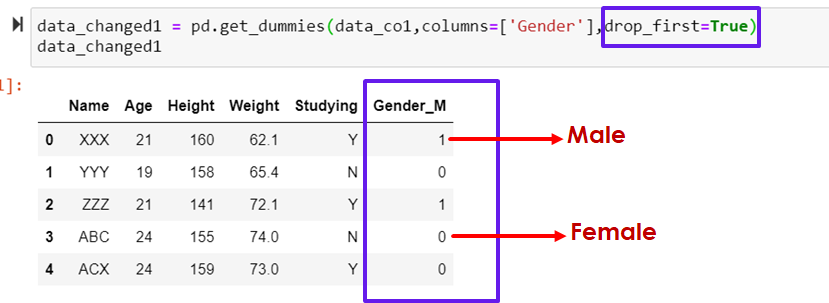
While dealing with machine learning algorithms, there may need to convert categorical variables to dummy variables, which are numeric variables that are used to represent categorical data
data_changed = pd.get_dummies(data_co1,columns=['Gender'],drop_first=False)
data_changed
data_changed1 = pd.get_dummies(data_co1,columns=['Gender'],drop_first=True)
data_changed1- data: The name of the pandas DataFrame
- prefix: A string to append to the front of the new dummy variable column
- columns: The name of the column(s) to convert to a dummy variable
- drop_first: Whether or not to drop the first dummy variable column
Creating multiple dummy variables
data_changed2 = pd.get_dummies(data_co1,columns=['Gender','Studying'],drop_first=True)
data_changed2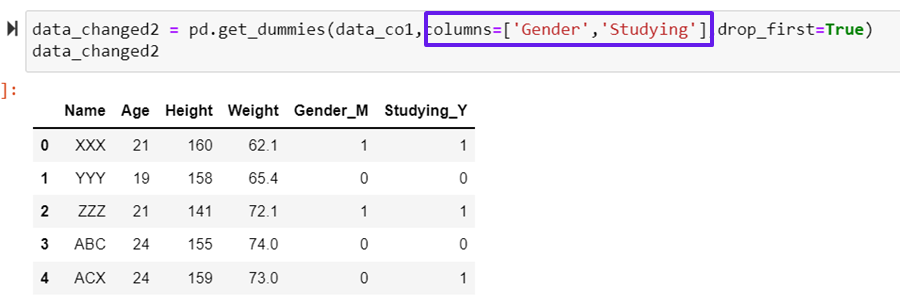
pivot_table
To summarize data which includes various statistical concepts
To calculate the percentage of a category in a pivot table, we calculate the ratio of category count to the total count
- pivot_table requires a data and an index parameter
- data is the Pandas dataframe you pass to the function
- index is the feature that allows you to group your data. The index feature will appear as an index in the resultant table
Syntax:
pd.pivot_table(dataframeobject, index=‘col name’]data_pt = pd.read_csv("F:/Advanced Python/Module - 2/Dataset/Dataset9.csv")
data_pt
pt = pd.pivot_table(data_pt,index=['Gender'])
pt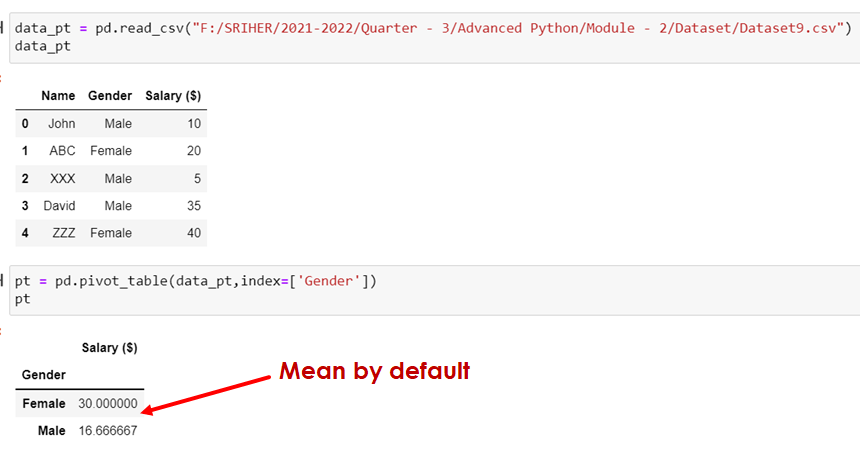
import numpy as np
pt1 = pd.pivot_table(data_pt,index=['Gender'],aggfunc = {'Salary':np.sum,'Age':np.median})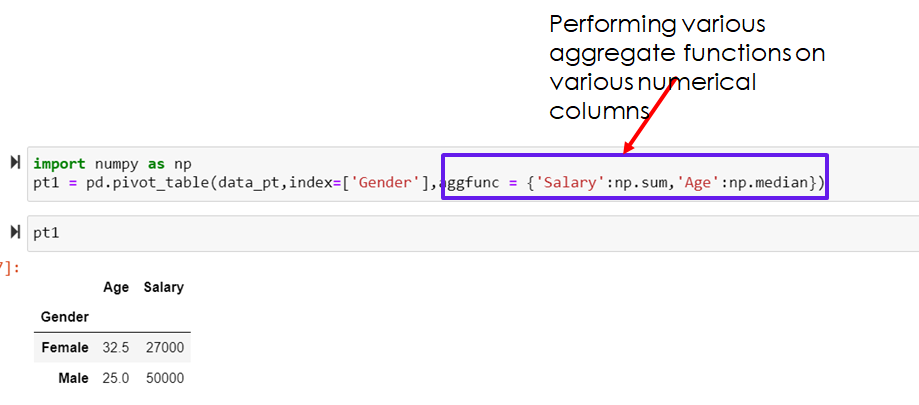
Views: 0