Table of Contents
show
Creating blank image
numpy.zeros(shape, dtype=float, order='C')import cv2
import numpy as np
import matplotlib.pyplot as plt
#creating blank image
blank_img = np.zeros(shape=(512,512,3),dtype=np.int16)
blank_img.shape
plt.imshow(blank_img)Drawing Rectangle
cv2.rectangle(image, start_point, end_point, color, thickness)- image: It is the image on which the rectangle is to be drawn.
- start_point: It is the starting coordinates of rectangle. The coordinates are represented as tuples of two values i.e. (X coordinate value, Y coordinate value). – top right corner
- end_point: It is the ending coordinates of rectangle. The coordinates are represented as tuples of two values i.e. (X coordinate value, Y coordinate value). – bottom left corner
- color: It is the color of border line of rectangle to be drawn. For BGR, we pass a tuple. eg: (255, 0, 0) for blue color.
- thickness: It is the thickness of the rectangle border line in px. Thickness of -1 px will fill the rectangle shape by the specified color.
- Return Value: It returns an image.
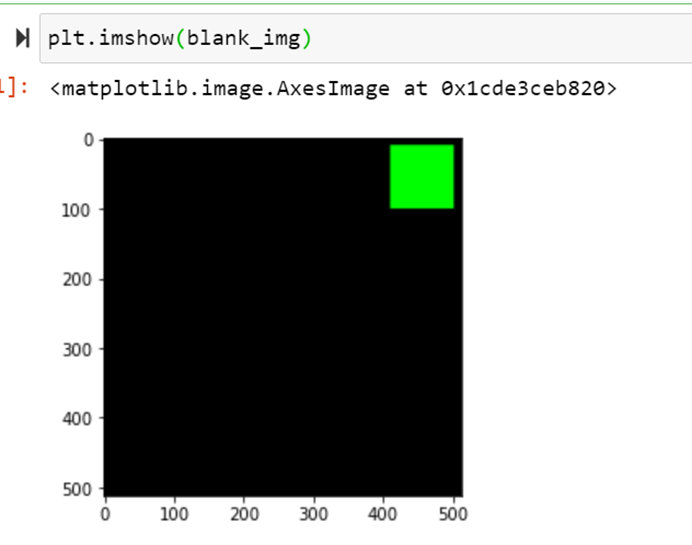
cv2.rectange(blank_img,pt1=(410,10), pt2=(500,100), color=(0,255,0), thickness=-1)
plt.imshow(blank_img)
cv2.rectange(blank_img,pt1=(410,10), pt2=(500,100), color=(0,255,0), thickness=10)
plt.imshow(blank_img)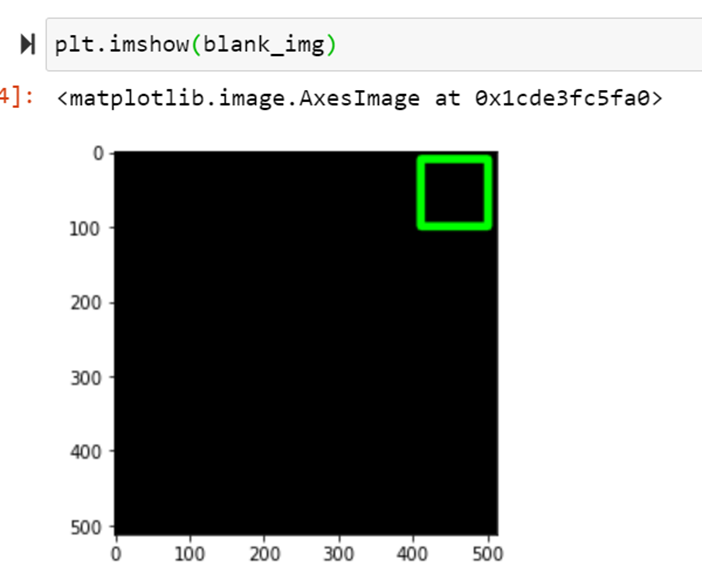
Drawing square
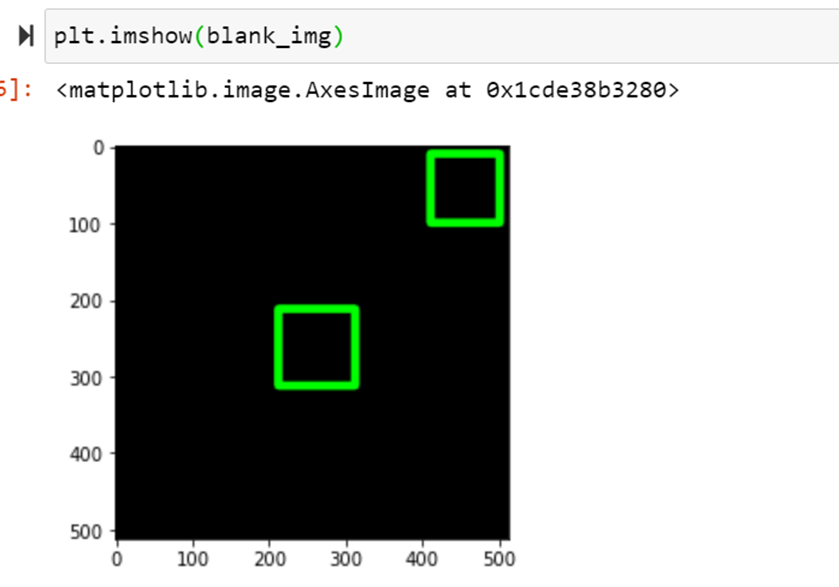
cv2.rectange(blank_img,pt1=(212,212), pt2=(312,312), color=(0,255,0), thickness=10)
plt.imshow(blank_img)
Drawing circle
cv2.circle(image, center_coordinates, radius, color, thickness)- image: It is the image on which the circle is to be drawn.
- center_coordinates: It is the center coordinates of the circle. The coordinates are represented as tuples of two values i.e. (X coordinate value, Y coordinate value).
- radius: It is the radius of the circle.
- color: It is the color of the borderline of a circle to be drawn. For BGR, we pass a tuple. eg: (255, 0, 0) for blue color.
- thickness: It is the thickness of the circle border line in px. Thickness of -1 px will fill the circle shape by the specified color.
- Return Value: It returns an image.
cv2.circle(img=blank_img,center=(100,100), radius=50, color=(255,0,0), thickness=8)
plt.imshow(blank_img)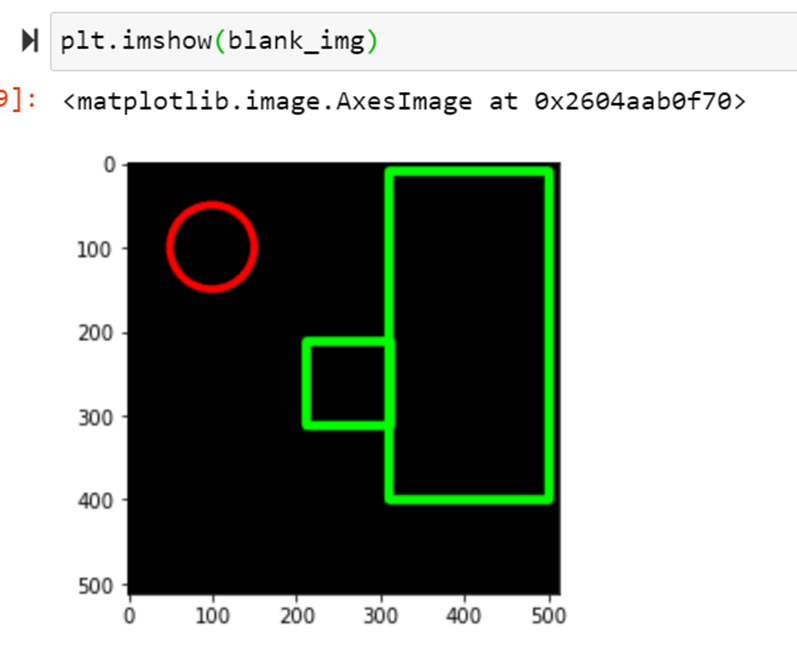
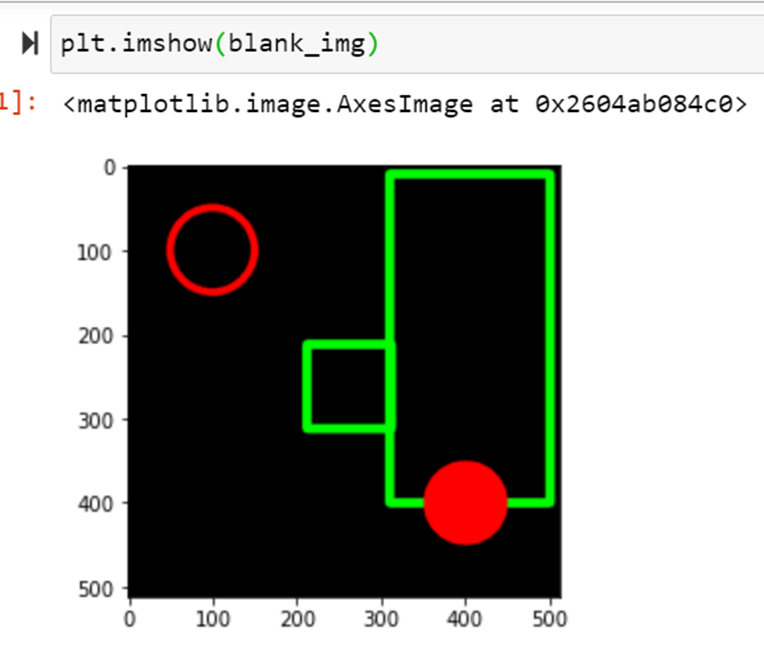
cv2.circle(img=blank_img,center=(400,400), radius=50, color=(255,0,0), thickness=-1)
plt.imshow(blank_img)
Drawing line
cv2.line(image, start_point, end_point, color, thickness)- Parameters: image: It is the image on which line is to be drawn.
- start_point: It is the starting coordinates of the line. The coordinates are represented as tuples of two values i.e. (X coordinate value, Y coordinate value).
- end_point: It is the ending coordinates of the line. The coordinates are represented as tuples of two values i.e. (X coordinate value, Y coordinate value).
- color: It is the color of the line to be drawn. For RGB, we pass a tuple. eg: (255, 0, 0) for blue color.
- thickness: It is the thickness of the line in px.
- Return Value: It returns an image.
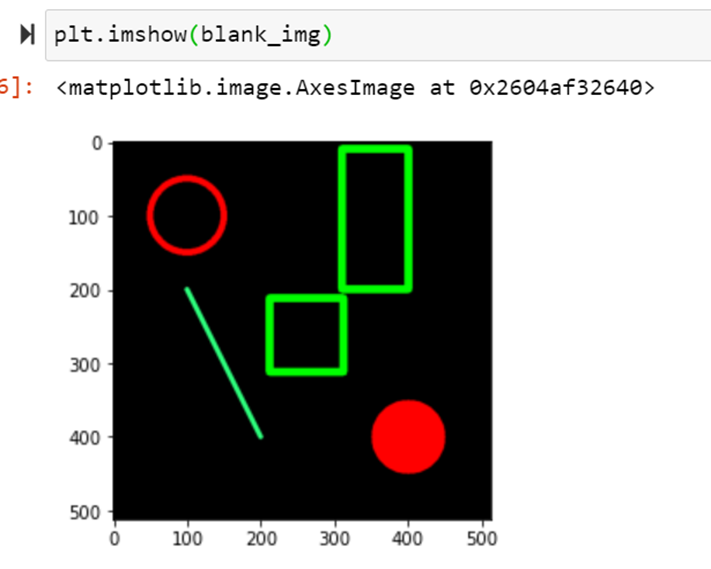
cv2.line(blank_img,pt1=(200,400), pt2=(100,200), color=(45,255,124), thickness=5)
plt.imshow(blank_img) ![]()
Views: 3